Map of Coffee Origins & Flavors

The visualization below is interactive and is another take on visualizing dominant flavor notes by origin.  We have mapped dominant tasting notes (color-coded) by country. Tap the visualization to explore first by country, or by tasting note.  At a high-level you can see how common different tasting notes are spread across countries and regions of origin. 

Free Shipping On Orders Over $30
Next up

Related Data Visualizations

Featured image of coffee flavor wheel data visualization.

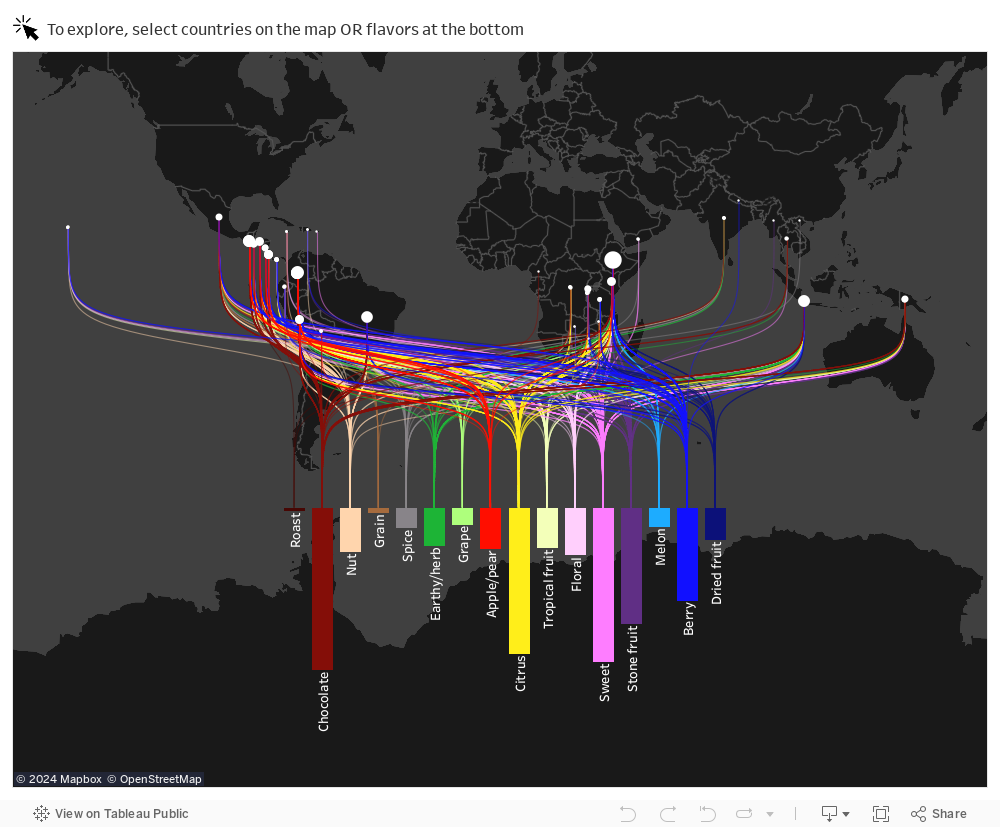
A Real Coffee Flavor Wheel

This is a real coffee flavor wheel, based on 1,200 actual single origin coffees and their tasting notes as described by the roasters. The size of each slice is proportionate to the frequency that note is mentioned across the 1,200 coffees …

A stacked area chart showing relative prevalence of tasting notes in coffees from specific regions.

1,203 Coffees: Origins and Tasting Notes

How does the taste of coffee vary based on the region it originates from? There are clear patterns when it comes to the dominant notes of coffees from different coffee-growing regions around the world …