A Real Coffee Flavor Wheel

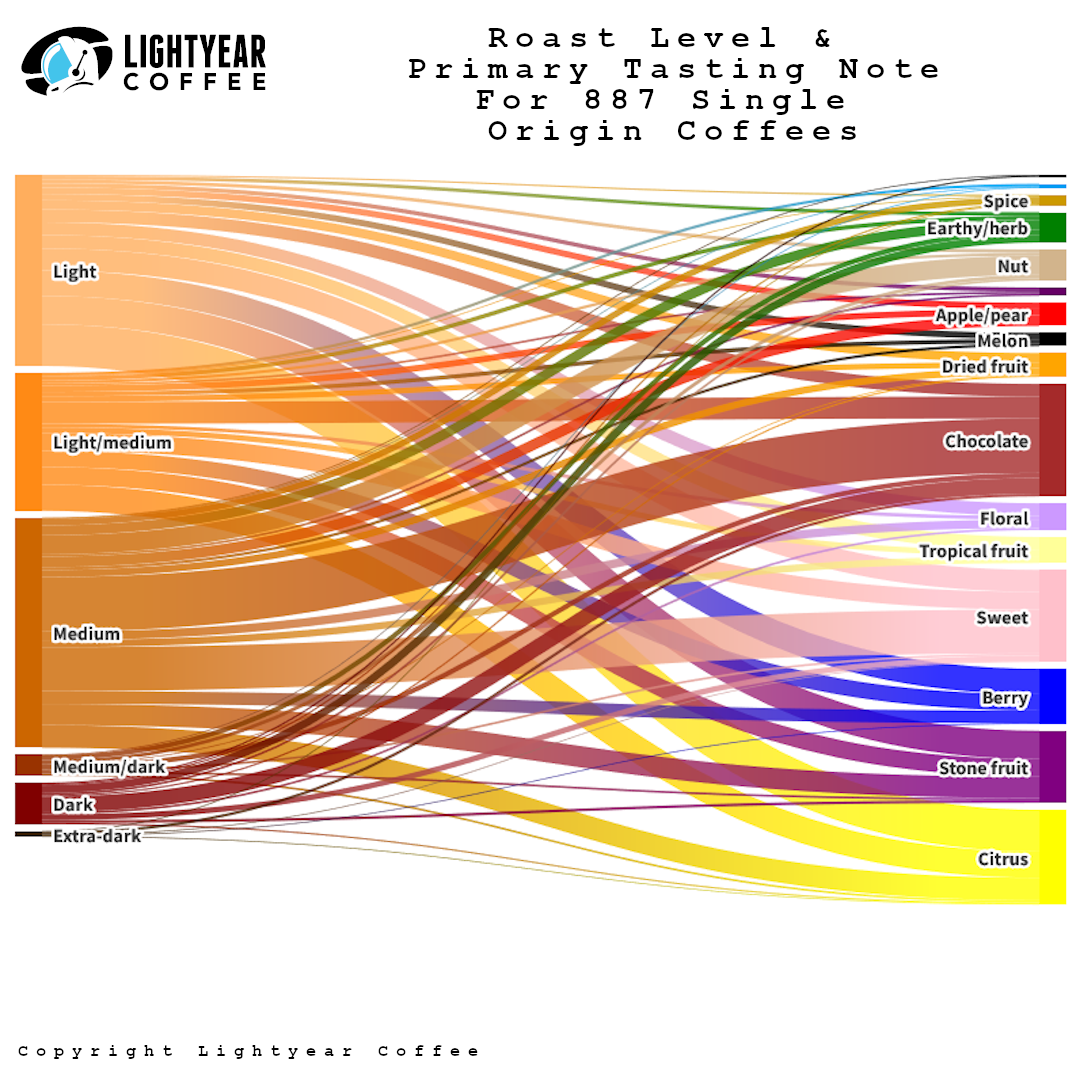
The data visualization below was generated using tasting note data from 1,200 single origin coffees from hundreds of small roasters around the US. The width of each slice is proportional to the number of coffees in the sample that were described using that particular term. Other coffee flavor wheels you may have seen in cafes or roasteries are visual dictionaries of all accepted terms that “could” be used to describe coffee (as per industry organizations or trade groups). The wheel below shows the terms that roasters are actually using, the terms that you will see on your next bag of coffee.

Free Shipping On Orders Over $30
Next up

Related Data Visualizations

Featured image of coffee flavor wheel data visualization.

A Real Coffee Flavor Wheel

This is a real coffee flavor wheel, based on 1,200 actual single origin coffees and their tasting notes as described by the roasters. The size of each slice is proportionate to the frequency that note is mentioned across the 1,200 coffees …

A stacked area chart showing relative prevalence of tasting notes in coffees from specific regions.

1,203 Coffees: Origins and Tasting Notes

How does the taste of coffee vary based on the region it originates from? There are clear patterns when it comes to the dominant notes of coffees from different coffee-growing regions around the world …