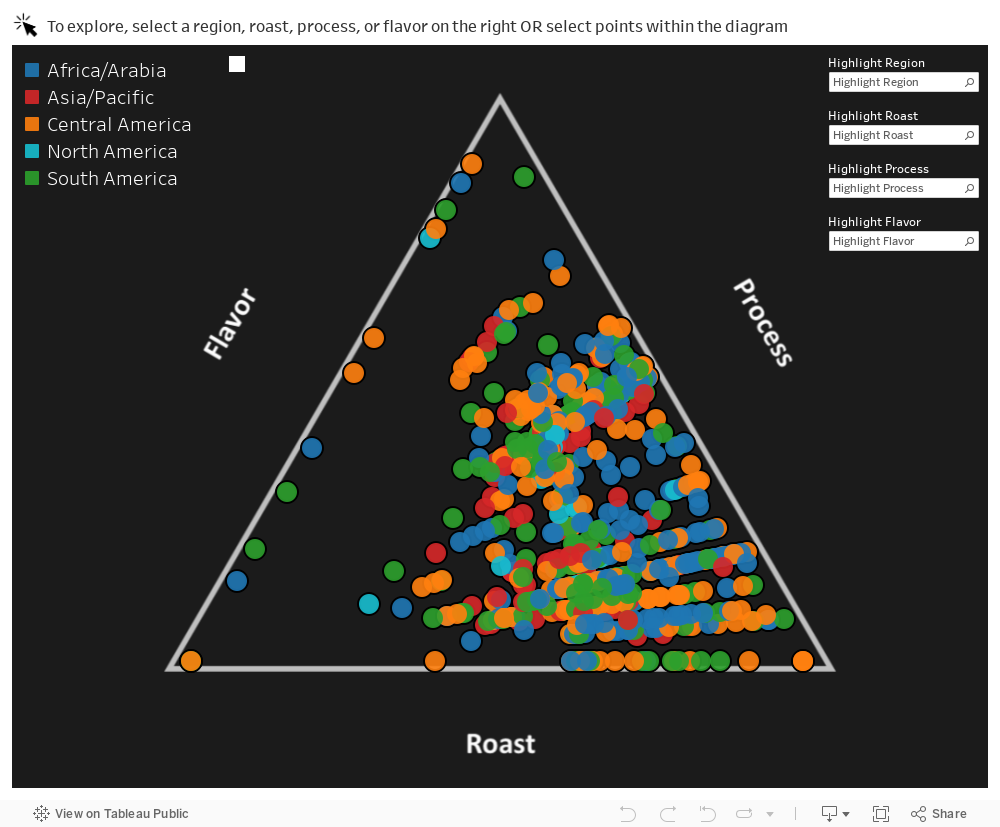
The visualization below is interactive and captures the relationships between coffee flavor, processing method, roast level, and region of origin (color coded). Each point in the 3-axis ternary plot is an individual single origin coffee. The different flavors, processing methods, and roast levels move along their respective axis. Hover over (or tap) individual dots to see that coffee’s triangulation within the plot. Or, use the filters on the top right to highlight specific flavor categories, processing methods, roast levels, or regions of origin.