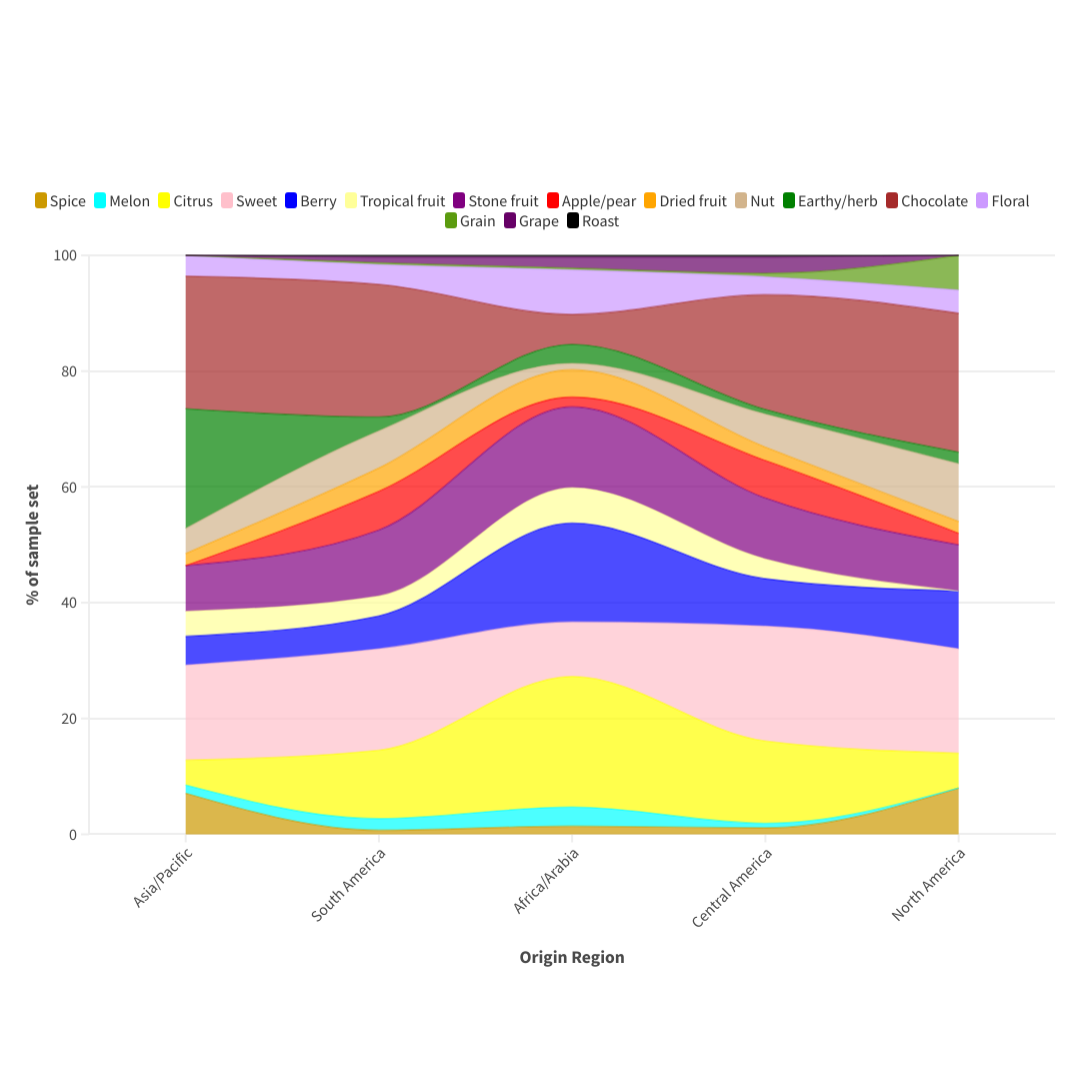
The visualization below shows how the primary tasting notes of single origin coffees (as defined by the roaster) change depending on what region the coffee is from. You can see that in the middle of the chart, which is the Africa/Arabica region, certain tasting notes are prominent, namely berry (blue) and citrus (yellow). This fits with the overall intrinsic profile of beans from countries such as Ethiopia, Rwanda, and Burundi. For coffees from the Asia/Pacific region, on the left side of the chart, you can see that earthy/herb (green) is prominent, as well as chocolate (brown) – consistent with the composition of coffees from Sumatra and India, as examples.


A Real Coffee Flavor Wheel
This is a real coffee flavor wheel, based on 1,200 actual single origin coffees and their tasting notes as described by the roasters. The size of each slice is proportionate to the frequency that note is mentioned across the 1,200 coffees …